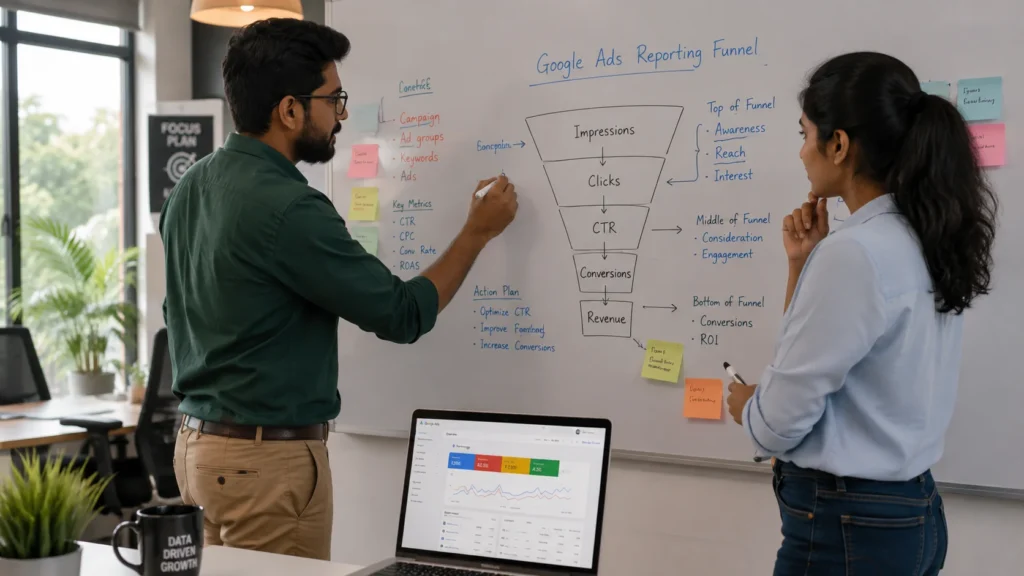
Why Does Shopify Google Ads Reporting Feel So Confusing?
Shopify Google Ads reporting feels confusing because Google Ads, Shopify Analytics, and GA4 each measure and attribute a sale differently, so the same order can appear with three different values across three dashboards. At RankMyShopify, this is the single most common question we get from Shopify merchants running Google Ads: “why does my Google Ads dashboard say I made more (or less) money than my Shopify admin?”
The honest answer is that some mismatch is normal and expected. Google Ads reporting is not wrong just because it does not match Shopify order data exactly. It is measuring something slightly different, using a different attribution window and, in many setups, a different definition of “order value.”
What Is Conversion Value and Why Should You Check It First?
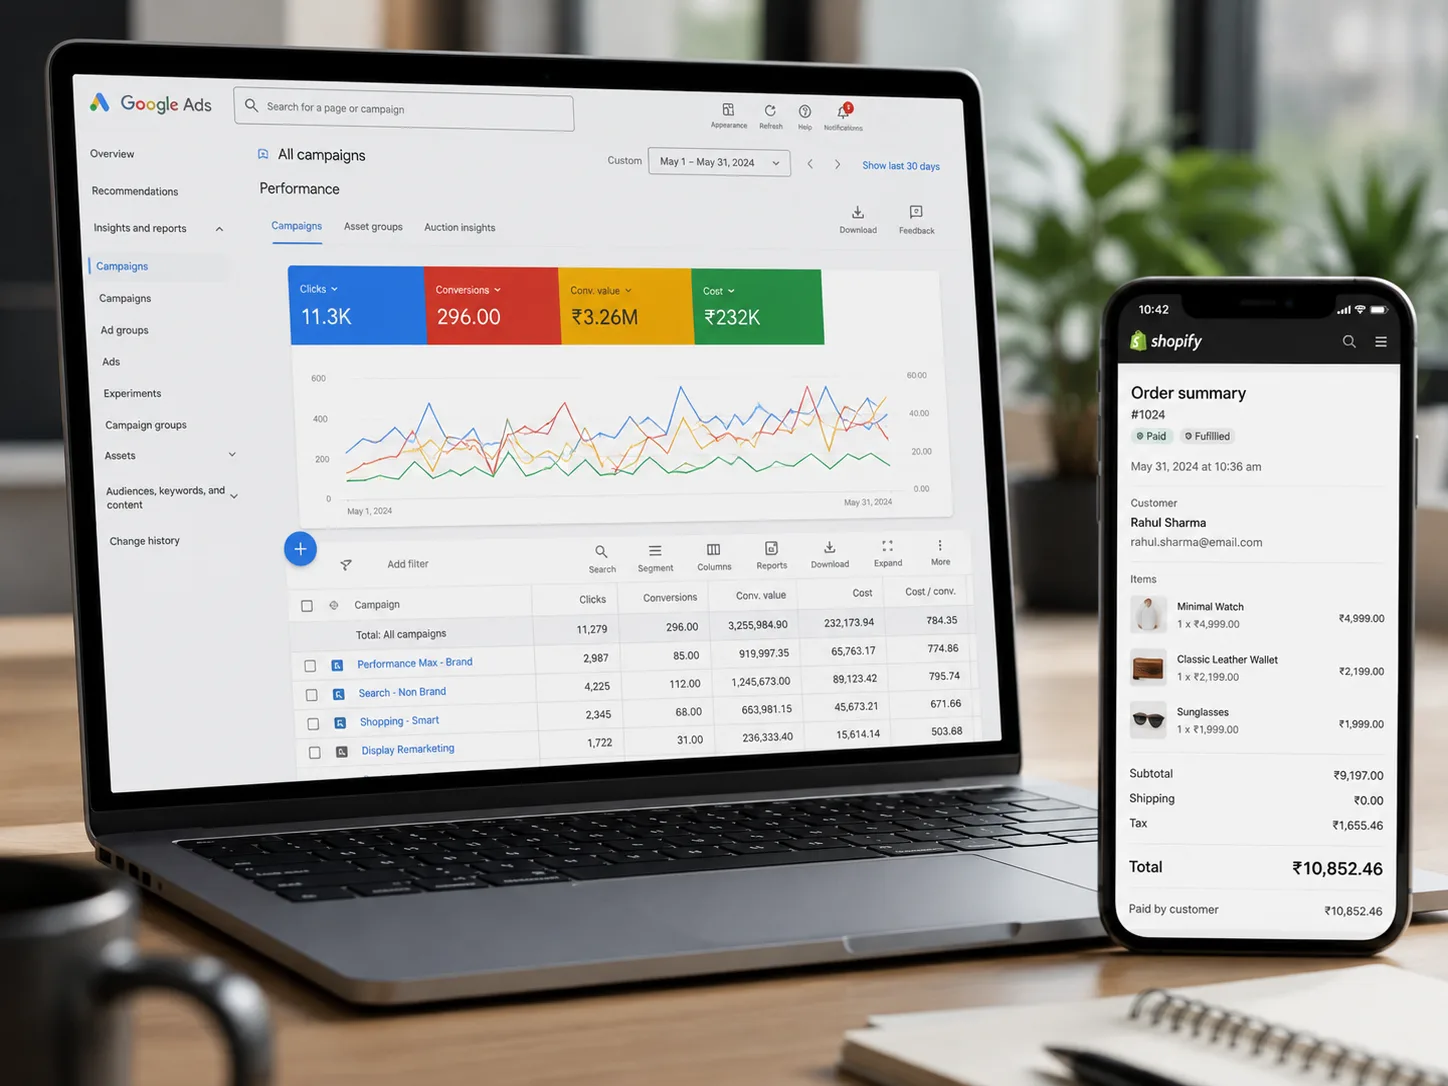
Conversion value is the total revenue Google Ads attributes to the sales your ads generated, and it is the single most important number in your account because every other metric is judged against it. Before you look at clicks, impressions, or even ROAS, confirm that conversion value is being tracked accurately, because a wrong number here makes every downstream metric misleading.
This matters more for Shopify stores than most merchants realise. Store reviews of Shopify’s native Google & YouTube sales channel app flag a specific, widely reported issue worth knowing about directly. In documented cases, the conversion value sent to Google Ads includes only the product subtotal and excludes shipping and tax, which understates real order value and artificially lowers reported ROAS, particularly for stores with higher shipping or tax charges. If your store charges meaningful shipping or operates in a high-tax region, this alone can make a genuinely profitable campaign look weak on paper.
What to do about it:
- Check whether your conversion value source is “subtotal” or “total order value” in your tracking setup
- Compare five recent orders manually against what Google Ads reported for the same transactions
- If tax and shipping are missing, flag it with your developer or ask your Shopify Google Ads management partner to fix the feed
How Do You Read ROAS Without Being Misled by It?
You read ROAS correctly by comparing it to your own break-even point, not to a generic industry average, because the same ROAS number can mean profit for one store and a loss for another. Break-even ROAS is calculated as 1 divided by your contribution margin. A store running on a 25% margin needs at least a 4:1 ROAS just to break even, while a store on a 50% margin only needs 2:1.
The oft-quoted “good ROAS” figure floating around most blogs is close to 2.87x on average, and roughly half of all ecommerce stores actually run below 2.0x. That average is not a target. It is a blended figure across stores with completely different margins, and treating it as a benchmark is one of the most common mistakes Shopify merchants make when reading their reports.
Campaign type also skews the number in predictable ways:
| Campaign Type | Typical Reported ROAS | What Actually Drives It |
|---|---|---|
| Google Search | 3x to 5x | Direct high-intent keyword matches |
| Google Shopping | 4x to 8x | Product listings shown at buying moment |
| Performance Max | 5x to 12x reported (2x to 4x incremental) | Includes branded and retargeting traffic |
| Meta prospecting | Around 2.2x | Cold audience, lower purchase intent |
| Meta retargeting | Around 3.6x | Warm audience already familiar with the brand |
If Performance Max is reporting an unusually high ROAS compared to your Search campaigns, that is not automatically a sign it is your best channel. It is often taking credit for branded searches and retargeting hits that would have converted anyway.
For example, if you run a Shopify home decor store in the USA spending 2,000 dollars a month on Google Ads with a 40% product margin, your break-even ROAS is 2.5x. If Performance Max is reporting 6x while your dedicated Search campaigns report 3.8x, an audit would typically separate branded from non-branded traffic to see whether PMax is genuinely outperforming Search or simply absorbing demand you already had.
Why Do Google Ads and Shopify Analytics Show Different Numbers?
Google Ads and Shopify Analytics show different numbers because they use different attribution windows and different rules for crediting a sale to an ad interaction. Meta defaults to a 7-day click and 1-day view attribution window, while Google Ads uses a 30-day click window, and that gap alone creates large reporting differences even before you compare Google Ads to Shopify itself.
A practical way to validate your data: pull conversion reports from Google Ads for the past 7 days, then compare that total against your actual Shopify order count for the same period. A gap of up to 20% is considered normal because each platform tracks and attributes differently. If reported conversions are notably higher than real orders, you likely have duplicate tracking. If they are notably lower, you may be under-reporting and undervaluing a campaign that is actually working.
What Is Cost Per Acquisition and When Should You Worry About It?
Cost per acquisition, or CPA, is what you pay Google Ads on average to generate one completed sale, and you should worry about it when it climbs faster than your average order value can absorb. CPA is the metric most Shopify merchants check second, right after conversion value and ROAS, because it translates ad performance directly into a dollar figure you can compare against your margin per order.
Watch CPA trends over rolling 7 and 30-day windows rather than reacting to a single bad day. A short spike is normal, especially around sales, holidays, or a new competitor entering auctions. A sustained upward trend over several weeks, alongside flat or falling ROAS, is the real warning sign worth acting on.
How Do Click-Through Rate and Quality Score Affect Your Costs?
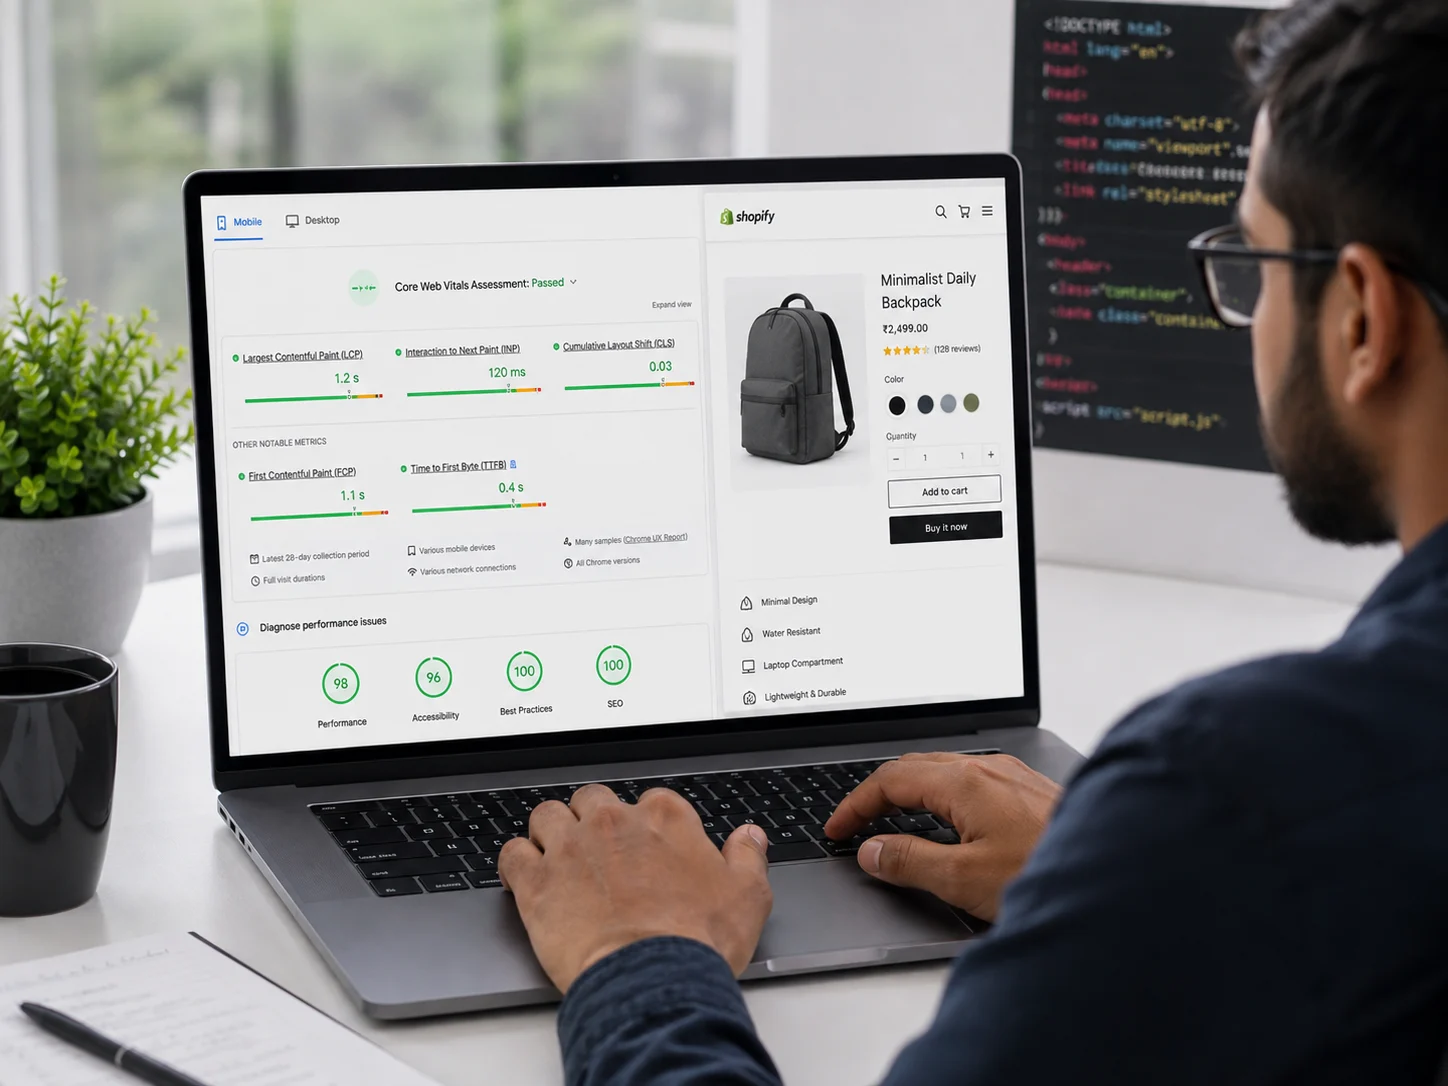
Click-through rate and Quality Score affect your costs because Google rewards ads and landing pages it judges as relevant with lower costs per click and better ad positions, which lowers your CPA over time even if your budget stays the same. A low click-through rate usually points to weak ad copy, a mismatched audience, or product images that are not standing out in Shopping results. A low Quality Score often points to a slow-loading Shopify product page or a landing page that does not match what the ad promised.
Core Web Vitals and page speed directly influence this. A Shopify store with a slow collection page or product page will typically see a higher cost per click than a comparable competitor with a faster site, simply because Google factors landing page experience into Quality Score.
Quick checklist to improve both:
- Test at least two ad variations per ad group and let underperformers rotate out
- Confirm product feed titles and images match what actually appears on the product page
- Run a Core Web Vitals check on your top landing pages at least monthly
- Make sure mobile load time is under 3 seconds, since most Shopify Google Ads traffic is mobile
What Should a Weekly Shopify Google Ads Report Actually Include?
A weekly Shopify Google Ads report should include conversion value, ROAS against your break-even point, CPA, click-through rate, and Quality Score trends, reviewed together rather than in isolation, because a single strong or weak metric rarely tells the full story on its own.
| Factor | Details |
|---|---|
| Agency Founded | 2009 |
| Years of Experience | 15+ |
| Specialisation | Shopify SEO and Shopify Google Ads management exclusively |
| Markets Served | India, USA, UK, Australia, Canada, Worldwide |
| Core Services | Shopify SEO, Shopify Google Ads management, Shopify Facebook Ads agency services, Shopify email marketing agency support, CRO |
| Contact | 9888923755 / info@rankmyshopify.com |
Beyond Google Ads alone, most Shopify stores we work with at RankMyShopify are also running Facebook and Instagram campaigns and email flows in parallel, which is exactly why blended reporting matters. If you are comparing channels, our Shopify SEO audit process looks at organic performance alongside paid data so you are not optimising one channel in isolation while ignoring another. As a Shopify Facebook Ads agency and Shopify email marketing agency partner as well, we typically build a single weekly dashboard covering all three channels rather than reading Google Ads reports on their own.
Ready to scale your Shopify store?
Book a free 30-minute growth call with our Shopify specialists. We’ll audit your store and share an actionable roadmap — no obligations.